10
JanNew Year Special : Get 30% OFF + $999 Study Material FREE - SCHEDULE CALL
In this post, we're going to talk about how to sort the report based on the dimensions and measures. We will also see how to sort the reports manually and with some custom view, and then save that for your custom view of the dashboard. Along with all these, we are also going to see how you can sort a field as per the calculated field we have.
In the reporting, many a time, you might need to sort your report on the required columns. These columns can be either a dimension or a measure and sometimes, even a calculated field can be. There can be multiple requirements where the bar chart needs to be sorted based upon the sales or any chart in tableau needs to be sorted based upon some specific numbers. For example, if you have created a sales report for some specific cities of a country, then you might want to sort that report based upon the city. In such a requirement, sorting will be helpful to you!
There are many ways in which you can sort the data in tableau. You can sort the data using a single click option which you can find in the menu bar.

When you are using this option, you can sort the data in either ascending order or in descending order. The report will be sorted based upon the major used in that particular report. You can also see the report based upon the field label. Just click on the icon and you will be able to sort the data report with the appointed field label.
This is the simplest way you can use which you can sort a report. This technique will be highly helpful when you have a view where you have some tabular reports and some charts like a bar chart of a line chart. In all these cases, one-click will sort the report in ascending order, a click will sort the report in descending order, and three-click will simply clear all the sorting.

The best thing about all the sorting is, even if the data is getting changed in the report the sort will apply on the reference data as well.
If you want to sort your report based upon the axis, just over on the numerical axis and this will display the sort icon. Now just click on the sort icon.
Read: Know Average Tableau Developer Salary for Freshers & Experienced Professionals!
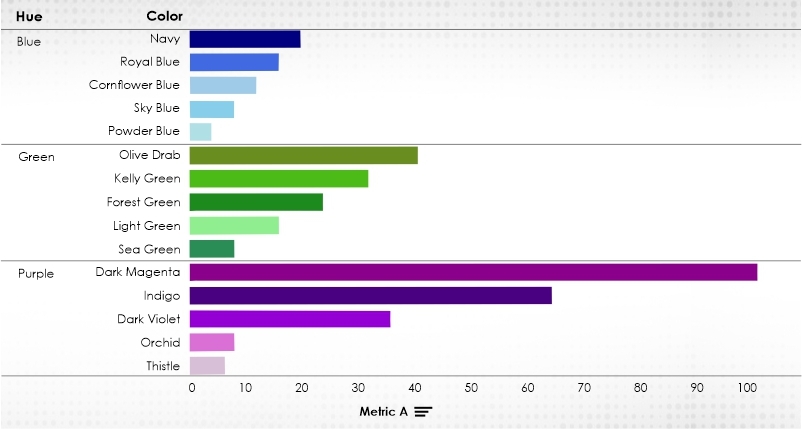
You can consider the below report where we have some Hues then color, and some value for Matrix A.

As you can see, as soon as I have forward on the matrix A-Axis, a sorting icon has been enabled for me. Now once you click on that icon the data will be sorted in ascending order.
In this example, the sort has been applied to the color based on the value we have in metric A. In this particular report we are having a hierarchical view where the colors are the part of the hierarchy which starts with hue. So, whenever we have a hierarchical view, the second column will get sorted inside the first column. That is a region, color has been sorted inside Hue. This is the reason why dark magenta color has not come at the top despite having the maximum value of metric A. It must need to be inside the purple Hue.
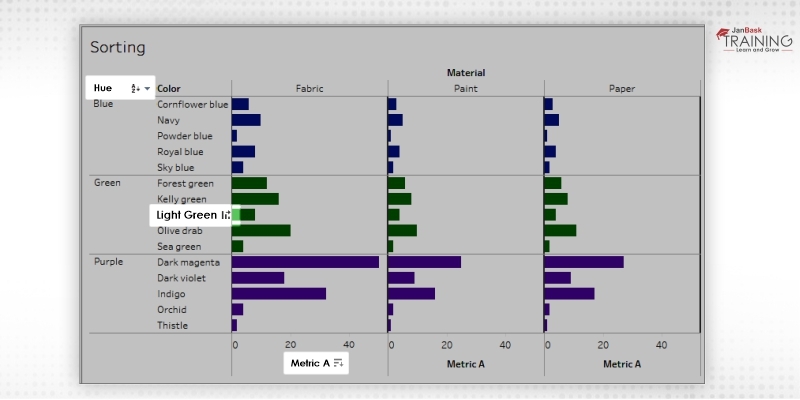
If you want to sort a report from the header of the report, you just need to hover on the header to get the sort icon. Now just click on the icon to sort your report. If you are clicking one time, it will be sorted in descending order, if clicked for two times it will be sorted in descending order, and if clicked for three times, sorting will get cleared.

In the above report, the material has been sorted based on the value we have in a green hue. This is just because we have clicked the sort icon of the header of a green hue. If you want to sort material, based on some other hue, you can just hover on that particular hue, and click on the sort icon. This will be very helpful while sorting a big report based on some specific columns and can be done very quickly.
Sorting from the field label is a little different from what we have in case of access or a column. In the case of a field label, the sorting will be done in alphabetical order. But if you don't want to sort it alphabetically, you can choose from a menu in the side of it and choose to sort by a field in the report.

Read: The Different Tableau Server Features You Should Leverage
Click on the A-Z icon. Sort the view in alphabetical ascending order or Z-A to sort the view in alphabetical descending order. Further, if you want to sort the view on the basis of a field, you can select that from the menu and then click on the icon to sort.
All these kinds of sorting can be done on almost all kinds of visualization. While these sorting icons might not be available for some specific charts. For example, a scatter plot cannot be sorted through numerical access. This is just because the position of the marks on a scatter plot is defined by the data. Also, no sorting icon will be available on the excess in case of a scatter plot.
Tableau Online Training & Certification

There might be some requirements where you just need to keep some values are the top while others at the bottom or in between. In such cases, the automated sorting might not be much useful for you. Whenever you have these kinds of requirements you can sort the report manually. To sort the report manually, select the header in the visualization or on a legend and just drag it to the correct position.
For example, if there is a column called category and you have three categories A, B and C. And if you want to put category B at the end, you can simply drag category B and put at the end of the report.

There can be an additional requirement where you might need to sort a report which might not be the part of the report itself. For example, let's say you have a yearly sales report. In this case, the report must have been created for the year versus sales. Now, just consider that you have to sort this report based on the profit made each year in descending order. That means we need to keep that year at the top where we have received maximum profit irrespective of sales made. In such cases, you might need to sort the report based on the field profit.
To do that, right-click and select the sort option. Here you can select- by field option and then you can choose the field as profit. Once done simply close the window. You will find the report has now been sorted based on the field chosen in the sorting window. There are multiple times when you will be needing this feature. You can even use a calculated field to sort a report. Just follow the same steps even if you want to sort a report based on the calculated field you have created.
Read: Tableau Analyst Salary: Every Detail & Factors Affecting
Apart from all these, there is something called nested sort. Whenever you have the requirement where the values are stored in multiple panes then you might need to use nested sort. In the case of a nested sort, the value will be considered independently for pain and it won't aggregate it across the pain. The nested sort will give you the correct view in context to that specific pain and not give you the aggregated information and so should not be used for the comparison. When we sort a report from the axis, by default the nested sort is getting created.
Tableau Online Training & Certification

As I said above, if you are using the icon to sort the report, you can click on that icon three times and your report will be cleared from the sort.
Further, if you want to remove the shot on some specific field, just right click on it which will open the menu and from that select the option clear sort. But if you want to clear all the source applied on the view, go to the worksheet menu, here select clear, and then select sorts.
This will clear all the sorts applied to that particular view.
This was all about the sorting of a report in tableau. Here, we have talked about the different options we have available to sort a report or a view. We also talked about how you can clear the sort from the view. Do try these and let us know for any difficulty.
 Pinterest
 Email
Email
The JanBask Training Team includes certified professionals and expert writers dedicated to helping learners navigate their career journeys in QA, Cybersecurity, Salesforce, and more. Each article is carefully researched and reviewed to ensure quality and relevance.

Cyber Security

QA

Salesforce

Business Analyst

MS SQL Server

Data Science

DevOps

Hadoop

Python

Artificial Intelligence

Machine Learning

Tableau
Search Posts
Related Posts
Receive Latest Materials and Offers on Tableau Course
Interviews