10
JanNew Year Special : Get 30% OFF + $999 Study Material FREE - SCHEDULE CALL
In this article, we are going to talk about what a group in Tableau is and how to implement grouping in Tableau. We will also talk about the difference between groups and sets. Additionally, we will see when to use a group and set while doing the reporting. Along with all these, we will see the Different techniques to create a group in Tableau.
The group is a feature that is like a custom field in Tableau to group or combine related items in the field. For example, if you are working on a report with say sub-categories by sales then you might want to group some of the top subcategories which are contributing the maximum sales to the organization.

You can see from the above bar chart, the subcategories like phone, chair, storage, Table, Binder, are contributing most of the sales to the superstore. So, you might want to group these top subcategories and might want to compare the sales from these subcategories to the total sales or remaining subcategories. In all the scenarios, a group in Tableau can be very helpful.
Along with the above scenarios, a group in Tableau can also be helpful while correcting errors along with answering somewhat if queries.
For example, if you have to combine the fields related to New York Which eventually says the same location and so should be in a single field. Groups can easily do all this kind of data cleaning. Also, if you want to ask the queries like what if you can combine the two locations or what will happen if you combine two subcategories. The group is capable of answering all such questions. These are some of the major reasons why groups are so popular while doing data reporting and Analytics.
If you want to create a group in Tableau there are multiple ways you can Follow. -
Both the above techniques work for a similar purpose. Now let's discuss both techniques one by one.
Read: What is set in Tableau and When to use Set-in Tableau?
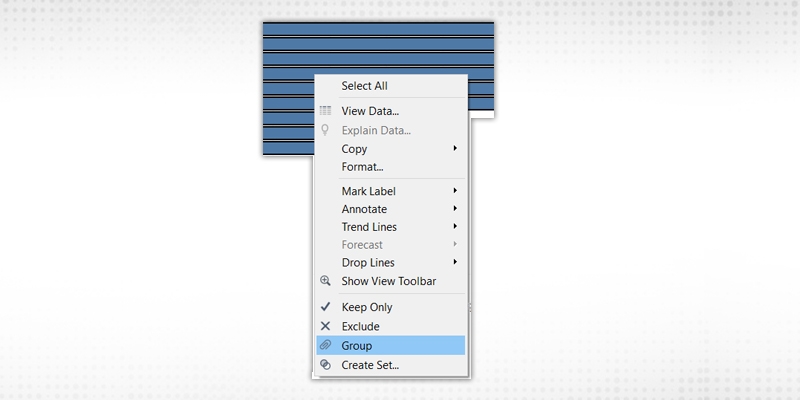
Here you first need to create a view. For example, I have a View where I am showing subcategory sales. You can create a similar view. Once you have created the view, just select all the bars you want to be a part of the group. Once selected, Right-click on it and select group.

This will simply create a group and it will add it to the filter shelf as well. You will find all the members which are a part of a group will be now with the blue color while remaining members will be labeled with the grey color and will be written as others. If you don't want the remaining member to be shown over there you can simply go to the filter self and unchecked other options.
Like a set, there won't be a different section getting created for the group. And the new group that you have created will be the part of the dimension itself. It will be a group name followed by that group icon.
Tableau Online Training & Certification

Later on, when you want to edit this group you can right-click on the group that you have created and select the edit group option. Here you will get a dialogue box where both the members will be listed one with all the members of the group other with all the remaining members of that particular dimension. Now, you can simply expand both the Hierarchy and reorder the members. For example, if you want to remove some of the members from the group you can simply drag that to the other part while if you want some of the members from the other to be the part of the group you can simply drag those to the part of the group.
By default, all the members who are part of the group will be named with the members only. If you want to rename the groups you can simply select that and click on rename and then you can write your required name.
Read: Introduction to Data Visualization with Tableau

If you want to change the field name itself you can simply write the desired field name. For example, by default, the field name is sab-category (group) which is the default name that has been created for the group. You should change this with the desired name like a group of top 6 subcategories.
If you want to add some members to be the part of the group or want to remove some members from the group you can either use the drag-drop feature or can take help of add to option.
Once you have made all the changes, simply click apply or ok to close the window. Now you can use group anywhere you want.
In the last section, we create a group by selecting some of the members from the view. Later we try to edit the group by rearranging the members and the different other features. We can also create a group from the data pane. To do that just follow the steps-
This will create a group for you with all the members who have selected in the dialogue box. Although you can change the members of the group anytime you require just by following the same way we have discussed in the last section.
Now all the selected members will be combined in the group and the default name will be provided to the group. If you want to change the name of the group just right click on it and select the edit group. In the end group dialogue box, you will be able to change the group name along with multiple other things that we have already discussed. When all the editing is done just click on OK. You can also rename the group just by right-clicking on it and selecting rename option.
If you have a lot of members in a group you can search the members using the find option you can find in the edit group dialogue box.
Read: Power BI vs Tableau - Top 8 Key Differences
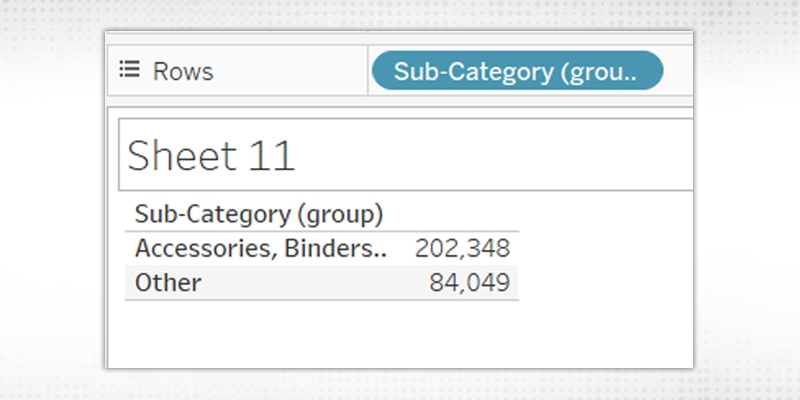
Now let's use the group we have created in the report and see the comparison. Let say, we want to see how much profit we have made from all the subcategories which are the part of the group and the remaining other subcategories. To do this, drag the subcategory group in the row shelf, and drag the profit measure into the text field. Once done, you will get like below -

As you can see from the above tabular report, the profit made by members of the group is way higher than the other members of the subcategories. This way you can do the comparison with different other measures as well. This Kind of comparison you can do only if you have selected another option in the group. Later, if you don't want to show the other option you can simply put that group on the filter shelf and uncheck the other option.
Apart From just comparing the values and making the corrections and asking the questions, you can also use the group to color a view.
Tableau Online Training & Certification

This was all about the group in Tableau. Groups majorly make a large number of dimensions easier by combining them into a higher level of categories. While the set is a subset of the data best on certain conditions for existing dimensions. Along with this grouping means grouping multiple members in a single dimension to a higher category while the set is grouping members from multiple dimensions into a dynamic group or a constant group. So, the set makes things dynamic.
You can now go and create the group and use it in your report to see the real action. While creating this if you face any difficulty do let us know.
Read: Types of Filters in Tableau
 Pinterest
 Email
Email
The JanBask Training Team includes certified professionals and expert writers dedicated to helping learners navigate their career journeys in QA, Cybersecurity, Salesforce, and more. Each article is carefully researched and reviewed to ensure quality and relevance.

Cyber Security

QA

Salesforce

Business Analyst

MS SQL Server

Data Science

DevOps

Hadoop

Python

Artificial Intelligence

Machine Learning

Tableau
Search Posts
Related Posts
Tableau Analyst Salary: Every Detail & Factors Affecting
![]() 3.6k
3.6k
6 Steps On How to Build an Impressive Tableau Developer Resumes (With Samples)
![]() 214.9k
214.9k
All You Need to Know About Tableau Certification
![]() 305.1k
305.1k
How and Why to Create a Pie Chart
![]() 5k
5k
Tableau Developer Resume Sample + Complete Guide on How to Make One
![]() 226k
226k
Receive Latest Materials and Offers on Tableau Course
Interviews