10
JanYear End Sale : Get Upto 50% OFF on Live Classes + $999 Worth of Study Material FREE! - SCHEDULE CALL
In this article, we will talk about what are the different types of filters available in tableau and when to use filters for the best of the use. We’ll also see if we can apply a single filter to the whole dashboard and can publish the same to the tableau server also.
Filters are used in tableau to exclude some data from the tableau view. It helps to make the dashboard compact and fast loading to the users. At the same time using filters can allow the user to see only those data on the dashboard which they are intended to and filtering the remaining set of data thus avoiding the loading time.
Let's understand why filters are so required in tableau or in any data visualization tool. Let’s say you have a global sales report. Here you may have different countries, even different states and so on. Now as this report is a global report show multiple users will be accessing this report. As there are a lot of users to this report and so there will be huge traffic on this and the resources required on this report will be a little more compared to the other report. Also, a chance that the loading time of such a report can be on the higher side.
Another problem with this is, we are showing the Global sales data but the sales head of the United State might not be interested to know what sales the company is making in the European region. So, what we can do in such cases is, we can filter out the report and can allow the user to select only their location. Thus, the US sales head will only see their data or can they can select the sales data related to the United States and the European region sales head will be able to select the sales related to the European region. This helps a lot when you are building a global report where multiple people or multiple categories of people will be having access to it. In this case, you can use a single selection filter and can decrease the loading time and increase the performance a lot.
Here are some of the top used filters in Tableau-
We are going to talk about all these filters one by one with examples in this particular article.
A data source filter is an important part of any data visualization. You are building a sales report on the Global data of an organization. Now you are an analyst for the United States and you are responsible to represent the data for the United States only.
But as you have received the access on the Global data set and you don't have any provision to query the data set at the database level and so you need to connect the entire data set to tableau.
Now as you have the Global data set and show the time left in the visualization in loading will be a lot more which is not useful. You may want to filter that data set for the United States only. You can achieve this with the help of a data source filter.
To implement the data source filter, connect your data source to tableau and in the data pane, you will find an option for the filter at the top right section. The best thing about the data source filter is it works on both live data as well as extract data.
Read: A Complete Guide On Dual Axis
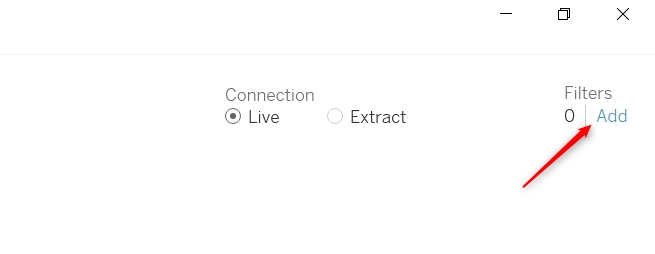
To add a filter, click on the add option. This will give you a popup box where you add the filter as required. For example, we have added the filter for same-day shipping.

This will add the same-day shipping filter to the entire data source itself. And when you will start working on this data set you will find the data only related to same-day shipping mode. This way you can restrict the data to enter into the report itself and thus increasing the performance and decreasing the loading time of the reports.
Extract filter is a filter that is applied to an extract in the data set. There are two kinds of connections available in tableau those are live connection and extract connection. As we know extract is a part of the data set which is required to get updated as and when required.
We need to live a connection when we need the data to be refreshed every time on the dashboard. Extract connection is suitable when we don't want the updated data to be shown every time instead the frequency is on some specified interval. Definitely extract connection help us improve the performance of the dashboard. So, when not required the live data coma tries to make the extract connection and update the extract on some defined interval. This update frequency can be daily, weekly, monthly, or even twice a day.
To implement the extract filter, click on the extract radio button under the connection option in the data pane.
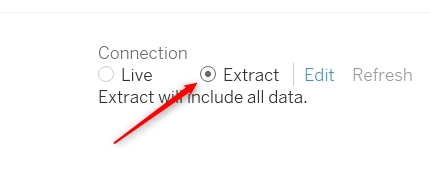
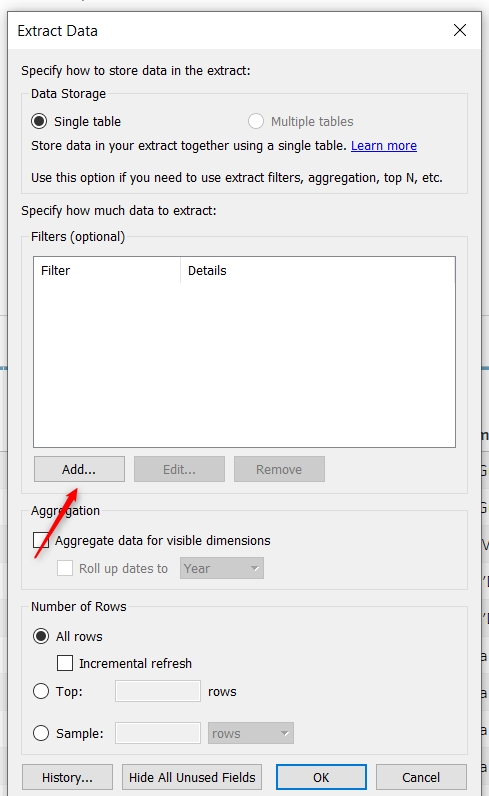
As you can see, currently it's an extract that will include all data. If you want to filter this extract just Click on the edit option and it will give you a set of details as a form of popup.
Read: A Complete Guide to Hierarchy in Tableau
On this pain click on the add button and add the filter as required to you. This will work exactly the same way as the data source filter has worked for us. But this filter will be applied to only the extract data and not the whole data. Extract filter will be very helpful when you don't need all the data in the extract. Also, while refreshing the extract it will help you improve your performance.
When we apply a filter on the dimension it is called a dimension filter. Dimension filter can be applied while we are on the worksheet and we are trying to create a report.
For example, we have the yearly sales trend shown-
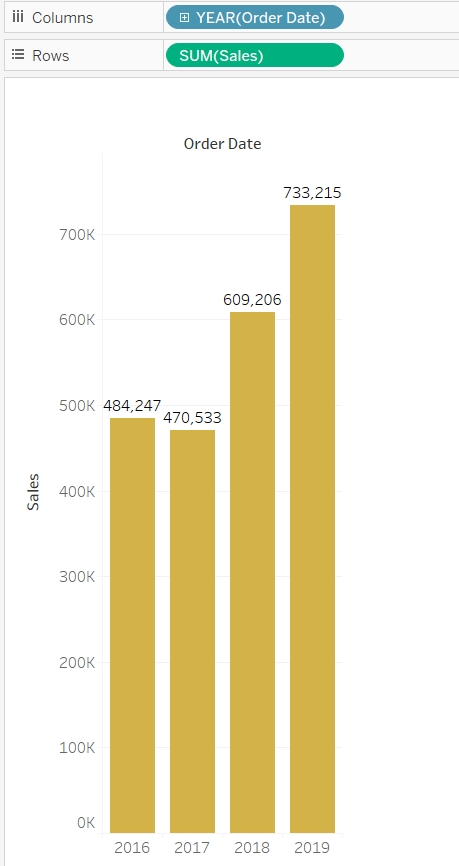
Now let's say we want this report to filtered on the basis of categories. As the category is a dimension in this case and so we need to apply dimension filter on this particular report. To filter the category, just drag the category dimension in the filter self and select all the options required from the pop options shown. Here I have used the “use all” option as I need all the categories in our report.
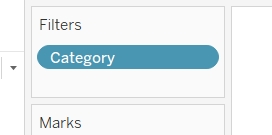
Currently, this is not available to the user. If you want this filter to be available to the user also right-click on this filter and select so filter option. This will add the filter option to the users also.
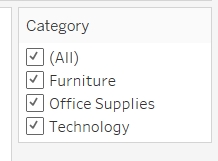
Here if the user wants, they can select one category, they can select two categories, or they can select all the categories. Depending on the selection of this filter the data in the sales report will get refreshed.
Similar to dimension filter we can also apply the filter on the measures. For example, let’s say, we want to add a filter on the number of records. This will be called as a measure filter. To add a measure filter, just drag the number of record measures into the filter self. Again, you will receive a pop-up option but this will be different than what we had in case of dimension filter. Now select the data on this pop-up option as per your requirement and click ok. In this case, I have used sum of the number of records.
Read: How to Create & Format Tableau Worksheet?
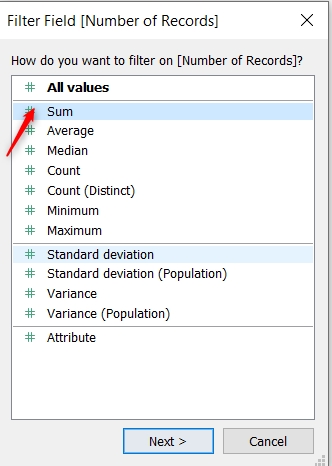
Again, this filter is currently not available to the user. And if you want this filter also to be available to the user right-click on the filter and select show filter. Now the filter will be available for the users also and then they can filter the report as per their need.
Context filter is a special case of a filter that basically creates a separate data set from your original data. You can add one or more dimensions filter to a context filter and then all the remaining filters will work in accordance with the context filter.
To create a context filter on category filter right click on the category filter and select add to the context.
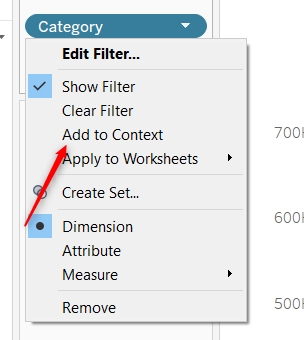
Adding a filter to contact you will find the color of the filter has been now changed.
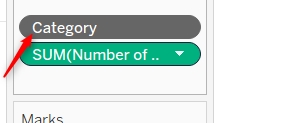
This color says the context filter has been applied. Now whatever filter you will apply on this worksheet for the dashboard will be applied in accordance with the context filter.
These were all about the different types of filters in tableau. We talked about data source filter, extract filter, dimension filter, measure filter, and context filter. We also talked about when to use these filters in our reporting needs.
I would recommend you go ahead and apply these filters in your real-time problems. And let us know if you will face any difficulty while implementing these filters or understanding these filters.
Read: Introduction to Data Visualization with Tableau
 Pinterest
 Email
Email
The JanBask Training Team includes certified professionals and expert writers dedicated to helping learners navigate their career journeys in QA, Cybersecurity, Salesforce, and more. Each article is carefully researched and reviewed to ensure quality and relevance.

Cyber Security

QA

Salesforce

Business Analyst

MS SQL Server

Data Science

DevOps

Hadoop

Python

Artificial Intelligence

Machine Learning

Tableau
Search Posts
Related Posts
Tableau Bar Chart - How to Create one?
![]() 6.3k
6.3k
Is Tableau Certification Worth it as They Really Say?
![]() 306.1k
306.1k
Tableau Developer Resume Sample + Complete Guide on How to Make One
![]() 225.9k
225.9k
All You Need to Know About Tableau Certification
![]() 305.1k
305.1k
Tableau Administrator Resumes - 7 Steps to Write One + Free Samples
![]() 4.2k
4.2k
Receive Latest Materials and Offers on Tableau Course
Interviews