09
JanYear End Sale : Get Upto 50% OFF on Live Classes + $999 Worth of Study Material FREE! - SCHEDULE CALL
So one of the most conceptual topics in the business analyst domain is here in front of you. The concepts laid over here are so interesting that you have a liking towards its conceptual side.
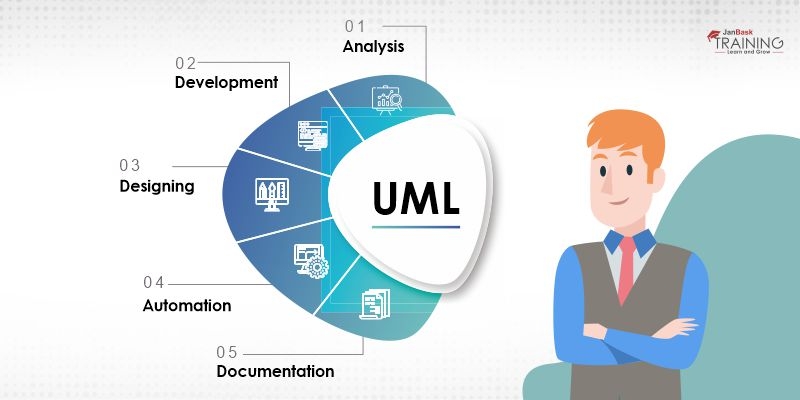
UML stands for Unified Modeling Language which acts as a catalyst in the software development life cycle providing a visualization for the design of the system. It makes sure that a business analyst visualizes the system statically as well as dynamically. Once the approach is finalized, it helps in drawing the exact set of diagrams and communicated accordingly to all the actors of the system.
Please make sure that you never get confused that it is a coding language, it is a visual language and can also be called as blueprints of the systems. UML’s are complex, but they help to provide proper design to the developers, and documents all the related investigations and analysis done for the implementation.
Here we are going to take you through the immense diversity of UML. Let’s see what all is stored for you to learn and explore -

Important Aspects and Usage of UML Diagrams -
Well, any language be it programming, modeling or visual has a deep history behind it. They go through the path of various analyses, publications, revisions, and final approval. Similarly, UML has an interesting history behind its evolution.
To make it more evident, UML has found is part of Object-Oriented design and has evolved from there. The late 1970s and early 1980s was the era of Object-Oriented Languages, but then year after year the number of design languages came into the picture. It was in mid-1990’s to be precise 1996, that UML came into existence. It brought a kind of stable approach for the developers to follow.
In the same year, there was a major demand for a major design language. The object-oriented group started asking for a proposal from the market players. This led to the launch of UML version 1.0, which came up as a combined result of three big giants – IBM, Microsoft, and Oracle. The current running version of UML is UML 2.5 which was released in June 2015.
But this history definitely has some strong minds behind it. An American Software Engineer, Grady Booch is said to be the man behind Unified Modeling Language. He was accompanied by Ivar Jacobson and James Rumbaugh. Grady’s innovation in the world of software architecture and engineering is deeply recognized and honored.
Read: How To Write the Perfect Business Analyst Resume To Get an Interview Call?
Ivar Jacobson, known as the creator is OOSE joined Grady and incorporated the concept of use cases in the unified modeling language. James Rumbaugh who is the person behind OMT left General Electric to join Grady for UML, in the year 1994. Collectively all three of them are famous as “Three Amigos”.
The Object Management Group is an association that has been formed to set common standards for object-oriented systems. This group now concentrates on modeling systems and business processes. This association is an international non-profit group formed in 1989. As its membership is open for any organization to participate in the standard-setting process, it looks into all the verticals before finalizing the new version of UML.
The process is initiated by a proposal method known as Request for Proposal which has all the details that need to be covered as part of this standard.
When you visit the website of OMG it will have all the details of UML. It would first show the latest and greatest UML version which is running in the market. The first detail is about the definition of Unified Modeling Language.
The details are then – Title, the commonly used acronym which is “UML”, the current version, document status, publication date, categories (which would be Modeling and Software Engineering most likely) and IPR Mode.
The website enables anyone to look into all the relevant details of UML or download the pdf version of the Specification. Object Management Group is so precise that even tells the users about the details that are mentioned in the spec document.
The best and flexible part of this association is that it lists down four important information –
The object management group also has the details of all the versions of launched UML’s. To explore more visit their website and see how each and every detail is well captured. Thus, the object management group not only governs the standards of UML but also brings it openly in the market. This enables the business analysts to align the design language as per the market standard and help their organization stay ahead among the competitors.
In simpler terms, the diagram which is based on the unified modeling language is known as UML diagram. These diagrams are being made with the intent of showcasing a visual representation of any system and are supported by actors, actions and artifacts. When any business analyst utilizes UML diagrams, it makes his/her analysis tasks much easier and leads to very transparent communication with the developers.
The UML diagrams can be segregated as -

Read: Things You Must Know About The Business Analysis Process
These are static UML diagrams that show the structure of any system. These static diagrams form the main basis of any system and it needs to be always stable. Structural UML Diagrams have further classifications as - Classes, Objects, Component and Deployment Diagrams.
Now that we went through the static diagram, there has to be a dynamic one. The dynamic diagram is the behavioral UML diagram which captures the moving aspects of any system. Primarily there are two types of behavioral diagrams which are interactions and static machines.
Going deeper dynamic diagrams are many other categories which will be seen in the next section.
Well in the world of business analyst, one can easily sense what importance UML diagrams hold. Business Analyst across industries uses multiple types of UML diagrams to give clarity and formal shape to their analysis. Let’s some of them which are of greatest importance.
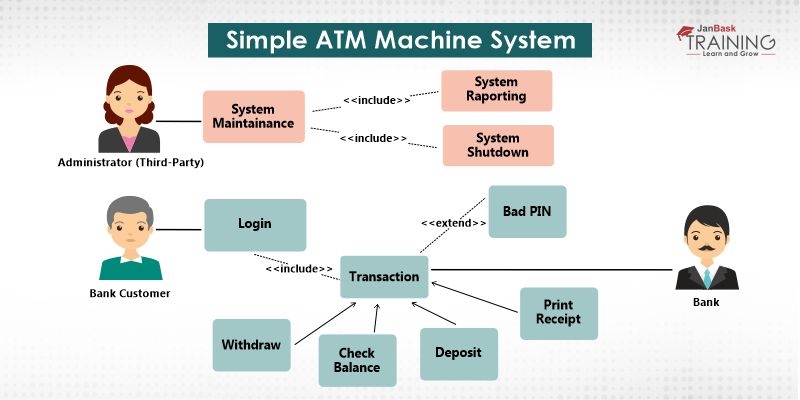
This is the most common diagram business analysts are hearing especially from the era of Agile. The use-case diagram shows visual representation of any functionality, the actors involved, different ways of using functions and how each feature interacts with each other. Use-Cases are the initiation diagram of any function as it can easily show what each actor is going to do as part of this functionality development.
Let’s take an example of designing a travel based app.
Some of the Use-Case could
and, many more.
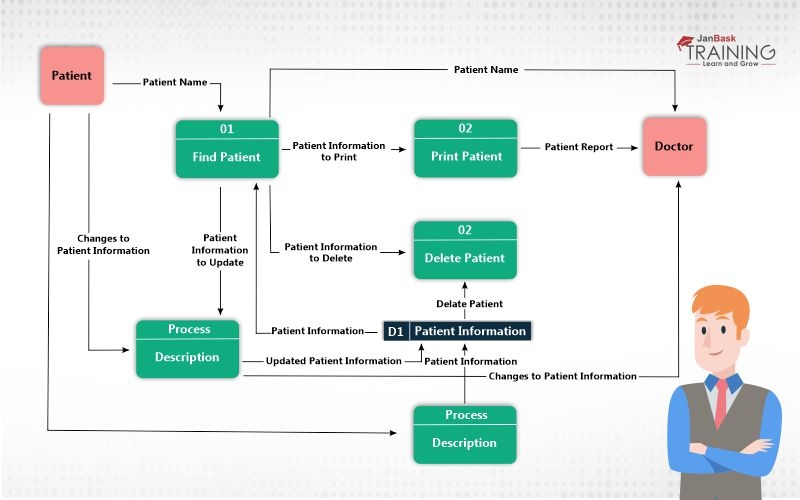
Another striking diagram is the data flow, which not only is used by the business analyst but also by other stakeholders because of its simplicity and easy to understand capability. The data flow diagram is a kind of sequential diagram, which shows how data flows between different actors through various connectors. The simplest form in data flow diagram can also be referred to as flow-charts.
Read: Entry Level Business Analyst Resume
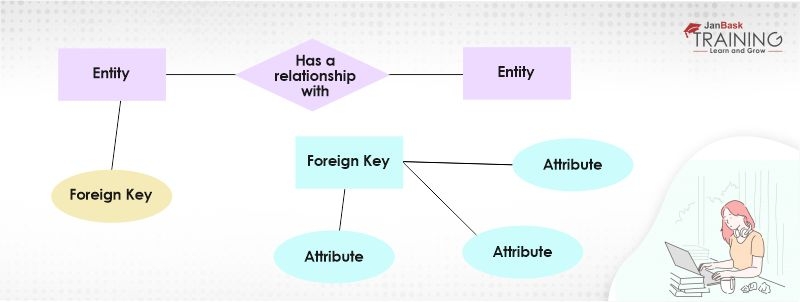
E-R diagrams are Entity-Relationship diagrams showing relationships among different entity sets. It is made in combination with an ER Model and mostly used to show the relationship in databases. An entity could be a table or attributes of a table. This diagram also uses symbols and connectors to show the relationship between two entities.

This diagram is one of the behavioral diagrams and is highly dependent on the present and past state of an entity. So basically these are state-dependent, as any entity behavior might change as per state of the diagram. This is also drawn in the form of flow where the initiation state is depicted by a round circle and the end is shown by a concentric circle.

This diagram works on the principle of modeling the actual deployment of a product and its artifacts to the respective nodes. It should definitely capture configuration details of run time processing, the firewall details, the switches involved and the details of the server responsible for the deployment.

When diagrams are represented in horizontal and vertical flow in unified modeling language, it forms the sequence diagram. The horizontal axis focuses on the entities that work as part of the interaction and the vertical axis focuses on the time.

A simplified version of Unified Modeling Language version 2.0, is called a communication diagram and it is much similar to the sequence diagram. But the sequence diagram works as per time evaluation whereas, communication diagram focuses on the available spaces for entities to communicate with each other.
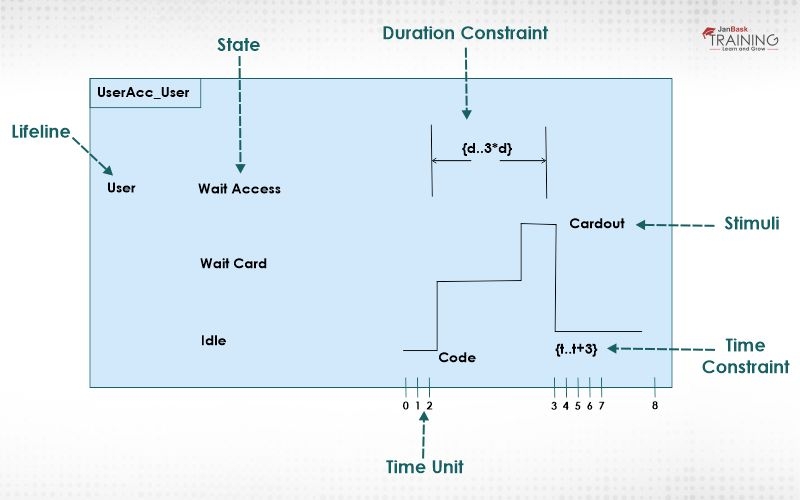
The UML interaction diagrams that are used to show connection when the actual purpose of the diagram is to reason about time is called timing diagram. It looks upon the conditions that are changing within and among lifelines. Both individual classifiers and interaction of multiple classifiers are being analyzed as part of the timing diagram.
As a business analyst, it is valuable to learn about the Unified Modeling Language. It is one of the vital skills that any business analyst should possess so that they can easily design the system requirements. Learning is a journey and not a destination. I hope you had a great learning experience on UML. Happy Learning Learners!!
Read: Top 11 Business Analytics Tools to Know About In 2025
 Pinterest
 Email
Email
The JanBask Training Team includes certified professionals and expert writers dedicated to helping learners navigate their career journeys in QA, Cybersecurity, Salesforce, and more. Each article is carefully researched and reviewed to ensure quality and relevance.

Cyber Security

QA

Salesforce

Business Analyst

MS SQL Server

Data Science

DevOps

Hadoop

Python

Artificial Intelligence

Machine Learning

Tableau
Search Posts
Related Posts
Business Analyst Salary Guide In 2025
![]() 5.7k
5.7k
Supply Chain Management Is So Famous, But Why?
![]() 9k
9k
How IT Enterprise Analysis Advance Is Going To Change Your Business Strategies.
![]() 4.3k
4.3k
What Are The Fundamental Categories Of A Business Intelligence (BI) Analysis?
![]() 518.3k
518.3k
Business Analyst Job Description 2025: Key Responsibilities
![]() 981k
981k
Receive Latest Materials and Offers on Business Analyst Course
Interviews