10
JanYear End Sale : Get Upto 50% OFF on Live Classes + $999 Worth of Study Material FREE! - SCHEDULE CALL
You must have seen some reports where some trend lines are shown...right? And if you have seen such kind of reports, those are highly helpful to understand how the business is working. These are nothing but data visualization.
In this post, we’re going to talk about the following- Roles, products, and career opportunities.
Data Visualization is a technique to represent the numbers in the form of charts and trends. Using these trends and charts, you can represent the large and complex data into an easily readable format. Nowadays all the organizations are using reporting to look at how their business is working and to make a decision based on the data, facts.
In the journey of data visualization, there are many tools that you can use. Some of the major tools are Tableau, Power BI, Qilk, Excel, and more.
No matter which tool you’re using for the reporting, the core concepts remain almost the same. The technique for graph selection, the way we craft the reports will always remain the same. So, we would like to suggest you start with one tool and master it. And later if you will need another tool also, just you will need an overview of the tool as the concept of reporting almost remains the same.
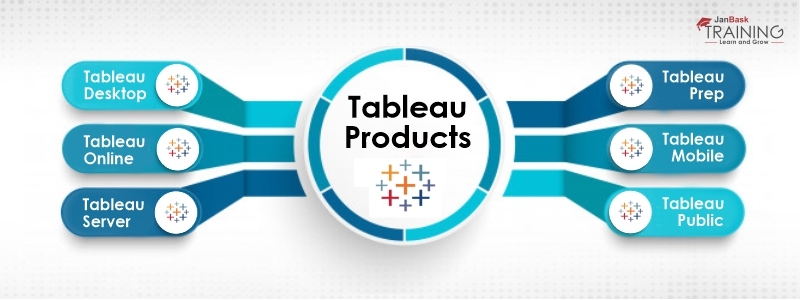
Tableau has a lot of products for different needs. Some of their top products are below-

1.Tableau Desktop
This is a development tool by tableau and allows the developers to create reports, dashboards, and stories as required. Most of the work by the Tableau developers will be done on the Tableau desktop only. It is a paid tool by Tableau and comes in the suit with price starting at $70.
2.Tableau Server
Tableau server is another premium tool by Tableau which helps to publish reports and share with others. With Tableau Server, you can share and manage the reports with others. You can allow others to have access and then manage those access. You can control which user will have what level of access.
3. Tableau Public
It is a free tool by tableau which helps you develop and publish the reports free. You can share the report with anyone. Just you need to understand that whatever you publish on Tableau public will be seen by anyone, even data. And so for sensitive information, tableau public is not recommended. Although it’s a great platform for building a portfolio and showcase your talent.
4. Tableau Mobile
This is another free product by Tableau which helps you view the dashboard and reports from Tableau server and Tableau online. Although you won’t be able to make any changes to the report just for viewing purpose this is a great tool. If your organization has mobile users then you can develop your report in Desktop and share those reports and then the user can see those reports in the mobile app which is available for both Android and iOS.
5. Tableau Online
This is a managed product by Tableau which allows your infrastructure to be managed by Tableau itself. With the help of Tableau online, you don’t have to worry about the infrastructure and Tableau manages those. But if you want your stuff locally then you can use Tableau server which is another paid tool.
6.Tableau Prep
This is the newest addition to the Tableau family which is being used for data preparation. You can use Tableau Prep for data preparation like cleaning, manipulating, and more. You can create a data pipeline in tableau prep and then connect those to tableau desktop.
Today Tableau developer is one of the most sought jobs in the business intelligence area. Multiple companies like HP, UnitedHealth Group, BCG, and others are hiring Tableau developer to get the insight of their data and visualize to take certain actions on it.
Tableau Online Training & Certification

If you’re new and have some interest in this tool, you might want to know more about the day to the activity of a Tableau developer.
In this post, we’re going to convey the same. Here we will talk about the role of a Tableau developer like what they do on a day to day basis.
The responsibilities may vary from role to role and organization-wide but in general, we can categorize it in the following sections-
#1 Gathering Requirement
You will be the part of requirement gathering where the stakeholder will tell you what they are looking for. For example, if it is a marketing-related project, they may ask you to create some solution that can tell them how beneficial their marketing campaign is.

Based on the requirement, you may ask some questions as well. These questions will be mainly those which you might need while developing the report. A typical question maybe-
Tableau Online Training & Certification

#2 Working on Data storage
Once you’re good with the requirement, the next step is to work on the data storage tool. Like where your data resides, are those in a single source or multiple sources, how you will pull the data and more.
Usually, your data can be in any data storage system. A typical project usually can have one or few of the following-
You should be good to write queries to these systems. Also, you should be comfortable writing the code for joins and blending. This also needs to write optimized queries. The more your database queries are optimized, the better solution you’ll be able to develop and more it will be adapted.
#3 Documentation
Another important responsibility of a tableau developer is to create the documents. You may need to create both requirement documents as well as technical documents. Initially, you will be needed to create the requirement document based on the requirements you have gathered or you have received.
Tableau Online Training & Certification

And then there will be multiple technical terms, technologies, and terminologies involved and so these all must be documented as well. You might need to create the wireframe as well which can help you get the approval before you develop the actual report.
#4 Create Report
Once you’re done with all the database related queries, it’s time to connect those data sources to Tableau desktop. Connect it and start creating the report based on the requirement. You may first create worksheets, and then arrange those worksheets to create a dashboard. Remember dashboard is client deliverable. While creating the dashboard, you may take care of the following-
#5 Publish Report
Once you have created the report (dashboard and/or story) then you need to share those reports with others. To do that you can publish those reports to Tableau Server or Tableau Online. Once published, you can share it with other users or embed them in the required pages.
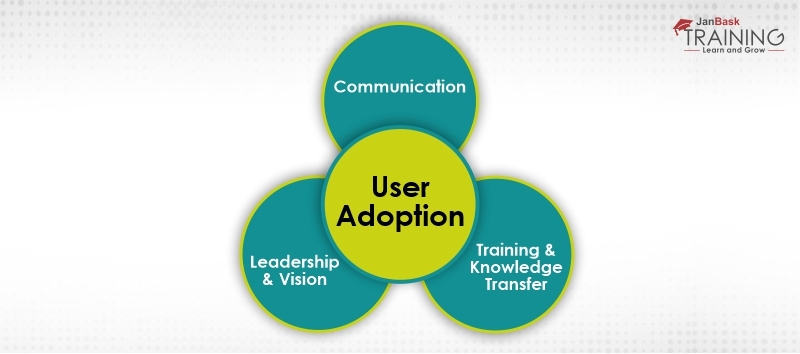
#6 Presentation and User Adoption
Once you have shared your report, you may need to make a presentation to your end-users and/or stakeholders. This will help you get your solution adopted quickly.

For the report developer, it is not only required to develop the solution but also to ensure those are being used and adopted. You can even track this with the help of a visit tracking code. You may use the tableau view feature or can use any tracking tool like Google analytics as well for this.
In short, a tableau developer develops the solution for the stakeholders to make business decisions based on the data. As the row data is not user-friendly and so a tableau developer will put that in the form of a report which can convey information and insights.
In this process, a tableau developer takes the help of dashboards, stories, and other visualization items to share the data insights, thoughts, and patterns.
This job is perfect for people who want to play with the data and find actionable insights from it. Like finding the pattern, creating trends, gathering insights, and more.
You will be the client-facing team who will be responsible for all kinds of reporting. Be it simple to complex trends and insights. For example, let’s say you’re working for a marketing organization then you may need to show some reports which will say what are the expenditure, profits, sales, and more.
These were all about data visualization. Here we have talked about the basics of the data visualization, different product lines of Tableau and also we have talked about the different roles and responsibilities of a Tableau Developer. I hope by now you must have understood about which all Tableau products you need for mastering the visualization along with what you will do after becoming the tableau developer or data visualization developer.
 Pinterest
 Email
Email
The JanBask Training Team includes certified professionals and expert writers dedicated to helping learners navigate their career journeys in QA, Cybersecurity, Salesforce, and more. Each article is carefully researched and reviewed to ensure quality and relevance.

Cyber Security

QA

Salesforce

Business Analyst

MS SQL Server

Data Science

DevOps

Hadoop

Python

Artificial Intelligence

Machine Learning

Tableau
Search Posts
Related Posts
Receive Latest Materials and Offers on Tableau Course
Interviews